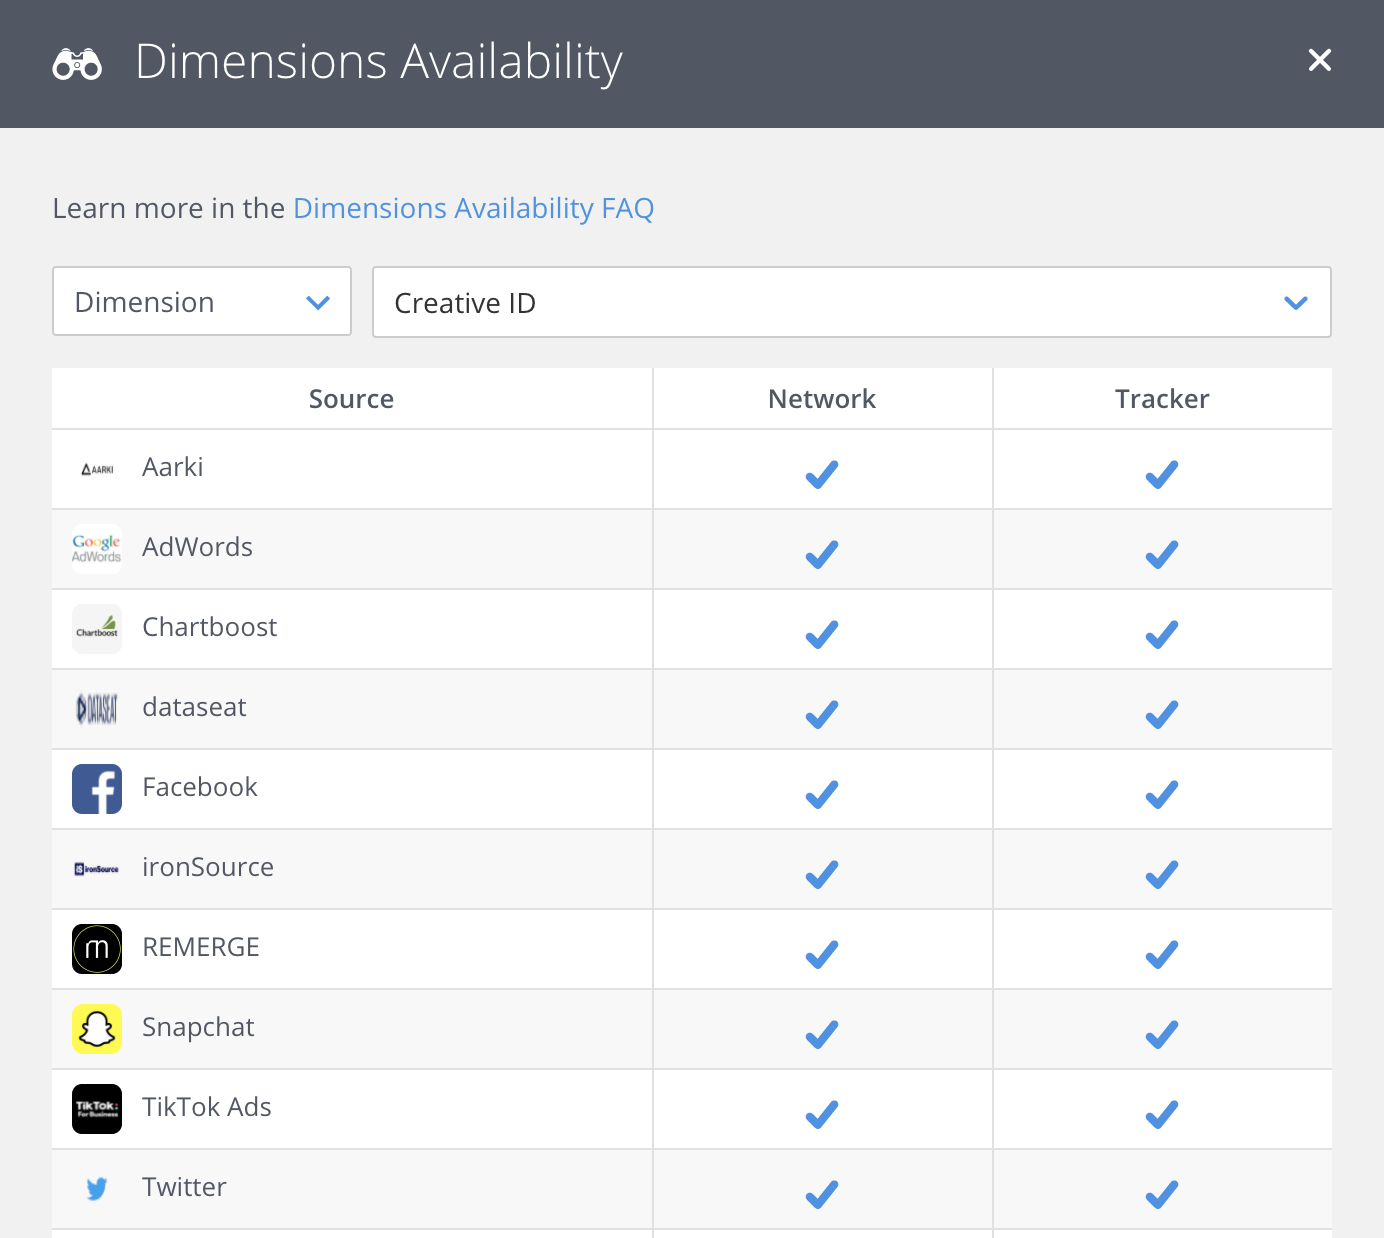
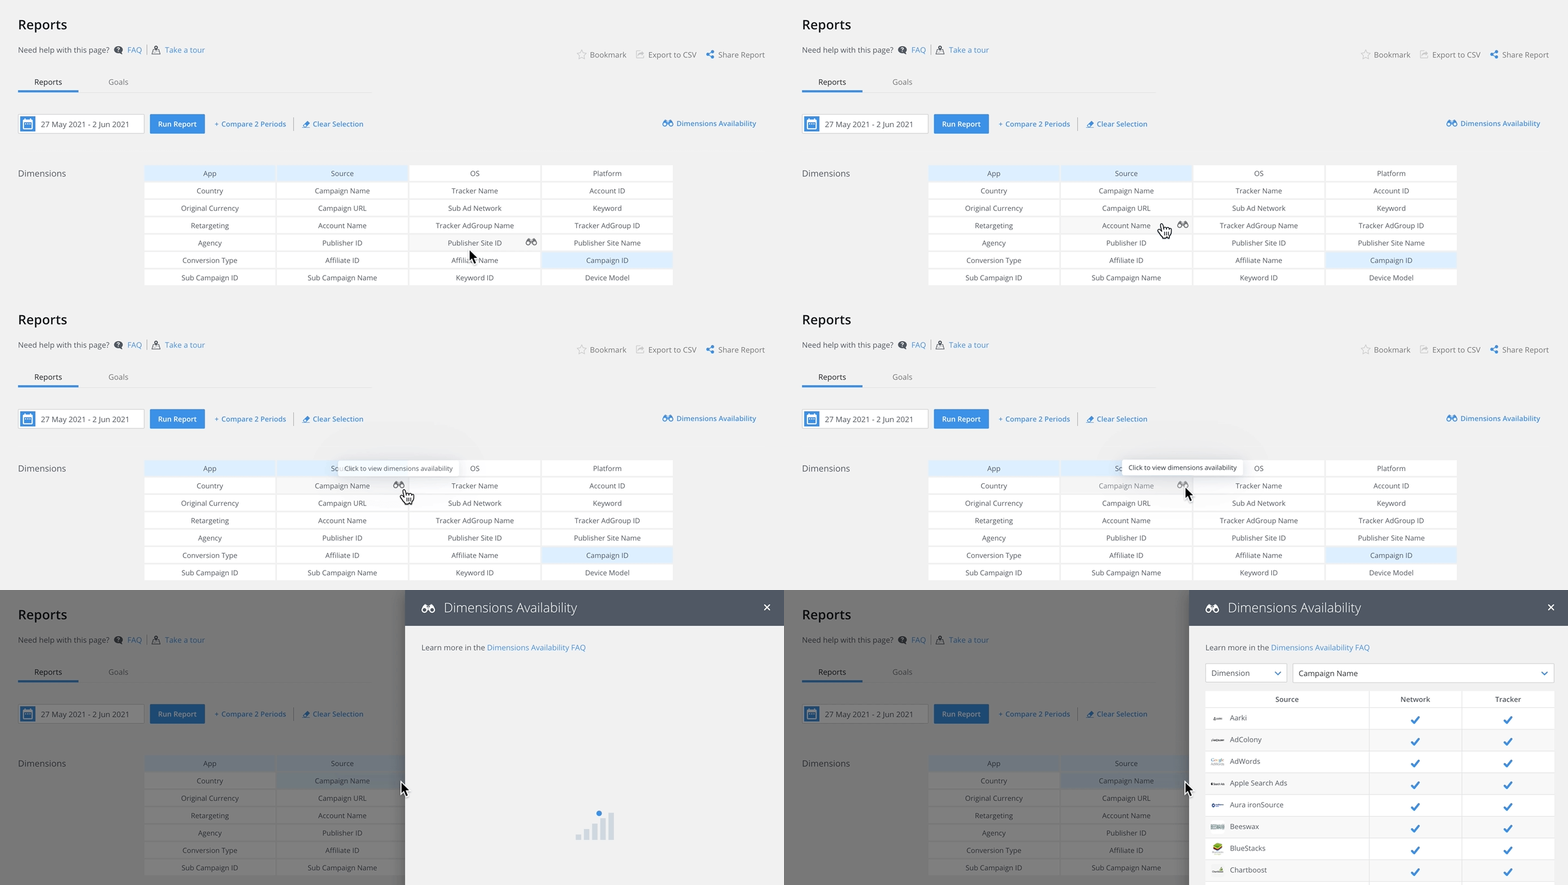
 The new Dimensions Availability window gives you full transparency into your reporting data by showing you which networks provide which dimensions to Singular.
By clicking the Dimensions Availability icon ![]() next to dimensions in reporting pages or next to data connectors in the Data Connectors page, you can see:
next to dimensions in reporting pages or next to data connectors in the Data Connectors page, you can see:
- For a given dimension, which of your networks provides it to Singular through the data connector, and whether we also get it on the tracker side.
- For a given network (data connector), which dimensions it provides to Singular, and whether we also get them on the tracker side.
If a dimension is available from both sides, it means you can run a report and see your CPI and ROI broken down by this dimension. This is because Singular can match the network metrics such as cost to tracker metrics such as installs and revenue for the given breakdown.
Troubleshooting
Dimensions Availability represents data from the past year. If you've advertised with a network in the past year, it shows up in the Dimensions Availability table.
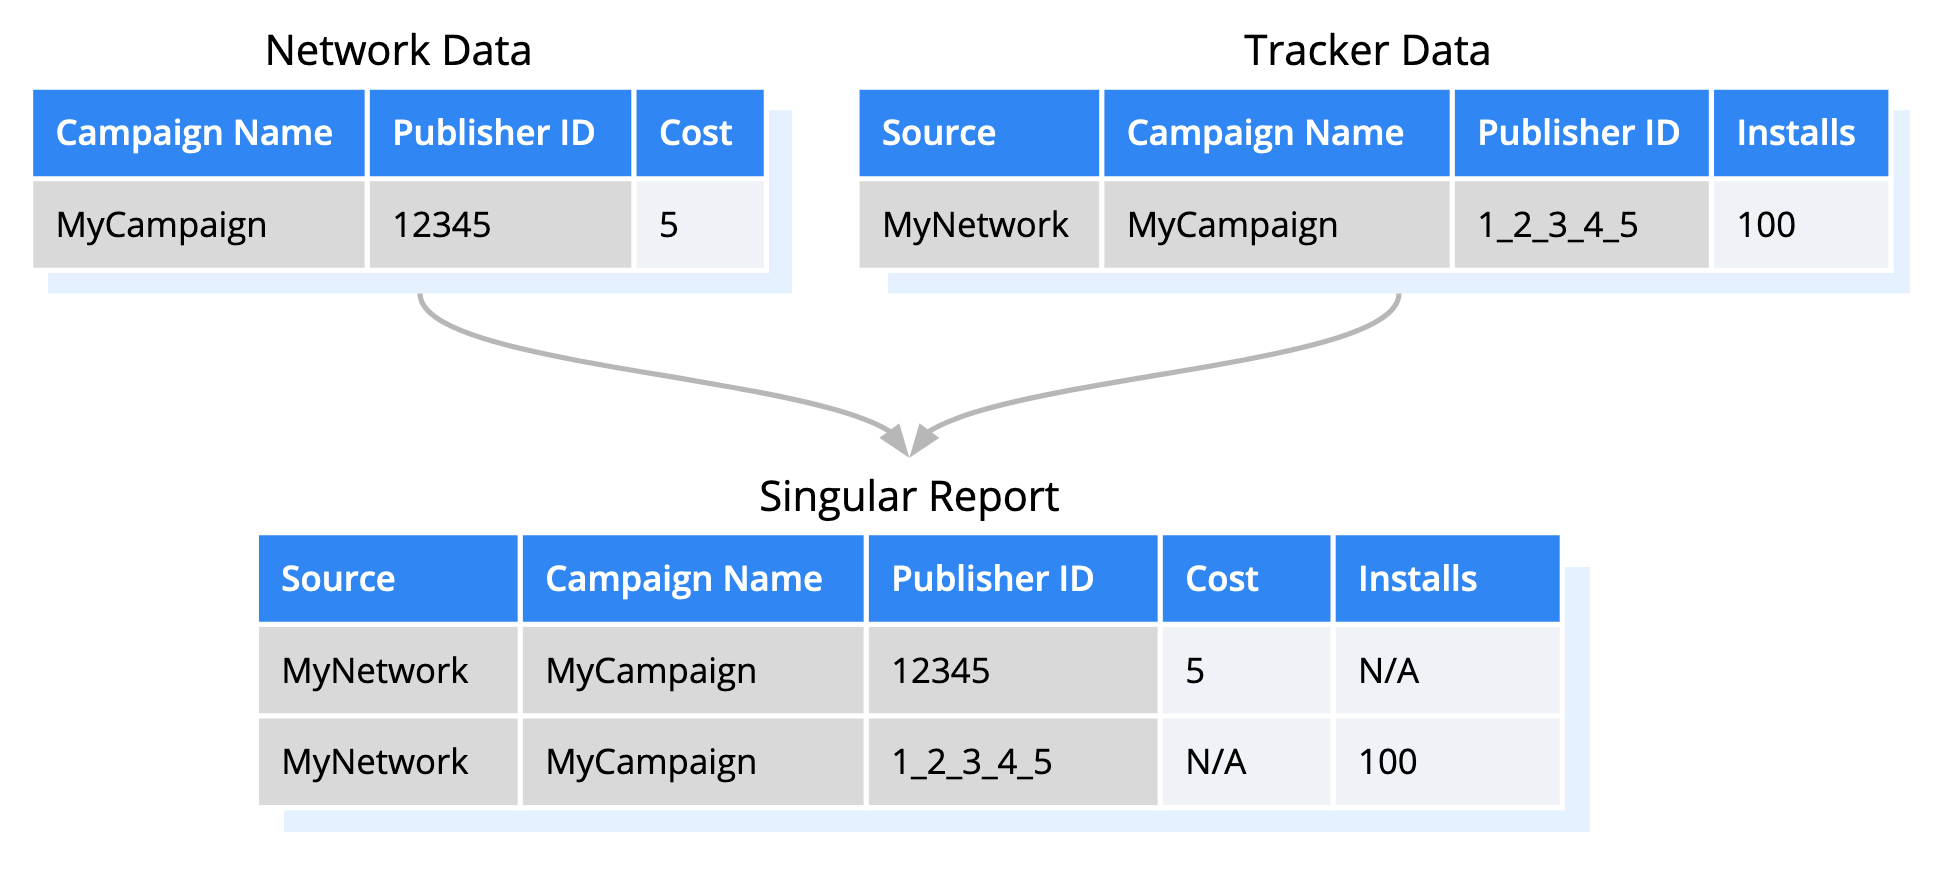
It's possible that, even though Singular is getting a dimension from both sides, the value doesn't match.
In the following example, Publisher ID is available from both the network and the tracker but with different values, preventing Singular from joining the data into one row in the report:

To learn more, see Understanding Singular Reporting Data: Joining Network and Tracker Data.
FAQ
Go to Analytics > Reports, Analytics > Creatives, or SKAdNetwork > Raw, hover over the dimension, and click the binoculars icon ![]() .
.

Go to Settings > Data Connectors, hover over the data connector for the network, and click the binoculars icon ![]() .
.

- Network data is aggregate data pulled by Singular from the network and ingested into Singular's analytics platform.
- Tracker data is data from Singular's attribution tracker. It's provided by the same network, but this time through passthrough parameters added to clicks and impressions.
Network and tracker data may have different granularity, with one dimension available on the network side but not available on the tracker side, or vice versa. This happens when a network does not provide all the same dimensions to Singular in both types of integrations (the analytics integration and the tracker integration).
For more information, see Understanding Singular Reporting Data.
| Icon | Meaning |
| Available: Singular pulls this dimension. | |
| Unavailable: This dimension is not available from this source. | |
| Singular Magic: Singular does not pull this dimension's data directly from the network but we still provide it through interpolation, the combiner process, or data mapping. To learn more about the methods Singular uses to help complete your data, see Understanding Singular Reporting Data. | |
| Missing Data Connector: You have not set up a data connector for this network, so Singular can't connect to it to pull network data such as cost. Go to the Settings > Data Connectors page to configure a data connector. See the Data Connectors FAQ for help. (We know you work with this network because we have data for it on the tracker side.) |
If a dimension is available from both sides, it means you can run a report and see your CPI and ROI broken down by this dimension.
This is because Singular can match the network metrics (such as cost) to tracker metrics (such as installs and revenue) for the given breakdown.
![]()
Hover over the icon to get more information. The possible methods are:
- Mapping: Singular derived the value from a different dimension provided by the same source. For example, the app name and the platform for which it was developed are often part of the campaign name, so if a network provides the campaign name, Singular can derive the App and Platform dimension values from it.
- Combining: Singular copied the dimension's value from the tracker side to the network side or vice versa in the combining process. For example, if the Campaign ID matches on both sides, we assume the Campaign Name should match also. To learn more, see Understanding Singular Reporting Data: The Singular Combiner.
- Interpolation: Network metrics were estimated for this dimension based on data from the tracker side. See Understanding Singular Reporting Data: Data Interpolation (Estimated Metrics).
The table is based on your own account data only and is updated daily.
To construct the availability table, Singular looks at your specific data for the past year and marks which breakdowns are available. For example, if at least 5% of your campaign cost from a particular network for the past year is associated with a Campaign ID, we mark Campaign ID as available.
Note: Some dimensions appear both in regular reports and creative reports. If one of these dimensions appears as available in the availability table, this applies to regular reports, not necessarily to creative reports.
In SKAdNetwork raw data (SKAdNetwork > Raw), you can see the availability of SKAN Campaign ID. This tells you whether we receive SKAdNetwork postbacks from any given network.
You can also see the availability of SKAN Publisher ID, SKAN Version, and SKAN View Through.
This is currently not supported.
A new dimension that is provided by a network will be shown as available in the table immediately after the next data pull (the next day).
A dimension that is not being provided anymore will still be shown as available for a time because Singular looks at your data a full year back.
